
Pricing the plots of a subdivision in Morocco: the plot-by-plot grid
In a subdivision, two neighbouring plots of the same size are not worth the same price. A corner plot facing a green space and a plot backing onto a transformer do not attract the same buyers. This is how a grid is built that gives every plot its own price, with a list price, a negotiation floor and a revision rule.
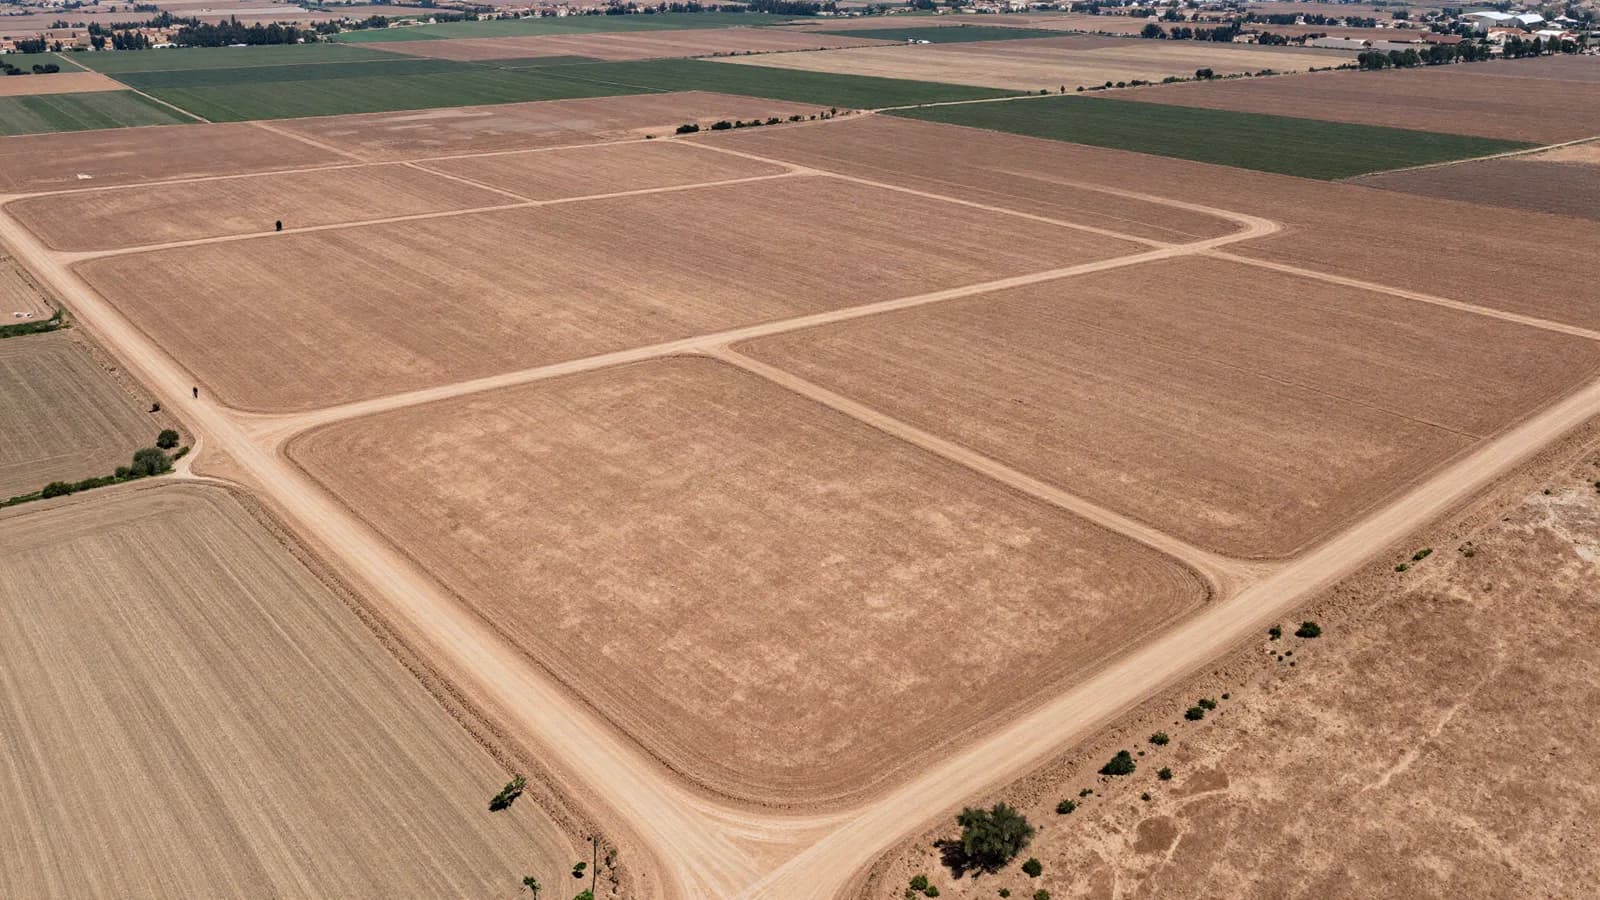
Pricing a subdivision is not about choosing a price per square metre. It is about distributing total revenue across dozens or hundreds of plots that are not equal, so that each one finds its buyer at the right time.
This article describes the grid we build, step by step, and what it cannot do. It rests on a market study of the project, which supplies the base prices. The service itself is presented on the pricing of plots and units for a property development page.
1. Why a single price per square metre loses money
The common reflex is to set one price per square metre for all villa plots, another for building plots, and multiply by the area. It is easy to explain. It is also the surest way to sell badly.
Buyers see the difference. From day one they reserve the corner plots, those facing the green space, those on the widest road. At a uniform price, these plots are sold below their value: the developer hands the buyer a premium it could have collected.
Then come the others: plots at the back of a phase, awkwardly shaped, close to a technical structure. At a uniform price they are too expensive for what they offer. They do not sell. The remaining stock is made up of the least desirable plots, and the only way out is a late discount, visible to everyone, which weakens prices across the rest of the scheme.
A single price therefore loses twice: on the good plots, sold too low, and on the difficult ones, sold too late. A plot-by-plot grid corrects both.
2. The starting point: the specifications and the plan
Before any price, you need to know what is being sold. The reference is the subdivision's approved specifications (the cahier des charges, stamped by the authorities) and its plan. For each plot they set the use (villa, apartment building, retail, public facility), the area and the building rights: height, footprint, setbacks.
This is the document that governs marketing. The local development plan (plan d'aménagement) supports it, to understand the surrounding area, but the specifications say what the buyer of a given plot will be allowed to build. Two plots of the same area do not have the same value if one allows an extra storey.
The areas used are those of the plan drawn up by the project's land surveyor. We do not carry out surveys: we are an advisory firm, and we work from the subdivision's technical documents.
A complete list of plots is then drawn up, with their characteristics. It is the first sheet of the workbook; every other sheet derives from it.
3. One base price per family of plots
Plots are grouped into homogeneous families: villa plots, building plots, retail plots. Each family receives a base price per square metre. It corresponds to the ordinary plot of the family: one frontage, a standard road, a regular shape, no particular strength or weakness.
This base price is not decided, it is derived from the market study: sales registered at the land registry, offers from competing subdivisions, and the benchmark of the tax administration's price reference. The method is detailed in our article on the market study for a property development, source by source.
When a family is very broad, it is split: villa plots of very different sizes do not address the same budget, and the price per square metre generally falls as the area rises. Two families with two base prices are better than one price corrected by an oversized coefficient.
4. Coefficients, plot by plot
Each plot is then compared with the ordinary plot of its family. Every difference becomes a coefficient: above 1 for a strength, below 1 for a weakness. The criteria we examine:
- Corner or double frontage. More light, more freedom to position the building, and for retail, more shop window.
- Road width. A wide road gives distance, parking and visibility. Depending on the specifications, it may also allow a greater height.
- View or green space. A plot facing a garden or an open view sells better than one facing another building.
- Proximity to a facility. School, mosque, local shops: a strength a few minutes away on foot, sometimes a nuisance when the plot is adjacent.
- Shape and size. A regular parcel is easier to build on than a pointed or very narrow one. An area well above the family's norm reduces the number of buyers.
- Nuisance. Electrical transformer, noisy road, technical structure nearby.
- Position in the phase. Entrance of the subdivision or far end, a phase already serviced or one still to come.
The formula fits on one line: plot price = base price × product of coefficients × area.
Three rules frame the exercise. Each coefficient is reasoned: a column in the workbook says why it applies to that plot. Coefficients are parameters to calibrate on the project's market, not constants: the corner premium in a villa subdivision is not the one in a subdivision of building plots, nor the one in another city. And there is no stacking: two criteria that describe the same advantage do not earn two premiums.
5. The calculation on three plots
Family: villa plots, base price of MAD 5,000 per sqm. Three fictitious plots. The coefficients are made up to show the calculation.
| Plot | Area | Coefficients | Product | Price per sqm | Plot price |
|---|---|---|---|---|---|
| A — ordinary plot | 300 sqm | none | 1.000 | MAD 5,000 | MAD 1,500,000 |
| B — corner, facing the green space | 320 sqm | corner 1.08 × green space 1.05 | 1.134 | MAD 5,670 | MAD 1,814,400 |
| C — near the transformer, irregular shape | 280 sqm | nuisance 0.93 × shape 0.96 | 0.8928 | MAD 4,464 | MAD 1,249,920 |
Reading: between plot B and plot C, the gap in price per square metre exceeds MAD 1,200, whereas a single price would have sold them at the same rate. In a real grid, amounts are rounded and each coefficient is calibrated on the project's market.
The price calculated here is the expected market value of the plot. It is the starting point for the two prices discussed next.
6. Two prices per plot: list price and floor
A plot does not carry one price, but two.
- The negotiation floor is the expected market value, the one that comes out of the grid. Below it, the sale eats into planned revenue.
- The list price is the one used in the sales presentation. It sits at the top of the range the market study can justify.
The gap between the two is the accepted negotiation margin. It is decided in advance, not discovered during discussions. The sales agent knows how far to go without asking for approval; beyond that, the decision goes up. This margin is also a parameter: it depends on local practice and on how strong demand is, and it may differ from one family of plots to another.
The list price has a limit: it must remain defensible against competing subdivisions. A list price far above the market does not create negotiation room; it keeps visitors away.
7. Building and retail plots: the residual check
The buyer of a villa plot buys for personal use. The buyer of a plot for an apartment building or retail is most often a professional who will build and resell. That buyer does not think in price per square metre of land; they run an appraisal.
For these plots, the price is therefore checked with a residual calculation. Start from what the specifications allow to be built on the plot. Estimate the revenue of the building that can be delivered, deduct construction costs, fees and the margin the buyer expects. What remains is the maximum price that buyer can pay for the land.
If the price from the grid exceeds that residual, the plot will not find a professional buyer, whatever its quality. The grid is then corrected. The reasoning is detailed in our article on residual land valuation for developers in Morocco, and the developer feasibility calculator lets you test orders of magnitude.
This check has its own assumptions: exit prices of the apartments, costs, margin. They are written down so that you can challenge them.
8. Plots outside the sales programme
Not every plot on the plan generates revenue. Land transferred for public facilities, technical structures and roads must be taken out of revenue. The grid lists them separately, with their area and status.
The classic mistake is to compute revenue on the total area of the site. Revenue is computed on the saleable area, plot by plot. The gap between the two is one of the first figures to check in a land developer's appraisal.
9. Running the sale: order, revision, tracking
A grid is not frozen on launch day. It comes with three operating rules.
The release order. Not all plots go on the market on the same day. Each phase mixes plots from different price levels, so that the best locations are not exhausted at launch and something remains to drive later phases.
The calendar also depends on subdivision law. As set out in our analysis of Law 34-21, which amends Law 25-90, provisional acceptance of the servicing works remains the event that allows plots to be transferred, and marketing a plot in a subdivision still under construction is expressly penalised. The sales phasing therefore follows the works phasing; for the detail of the texts, refer to that article.
The revision rule. It is written before launch. If a family of plots sells faster than expected, the prices of the remaining plots in that family are raised. If it sells more slowly, the cause is sought first: price, product, or simply a lack of visibility. Trigger thresholds are set with you, based on the expected pace. A revision decided calmly is better than a discount granted under pressure.
Tracking. Each plot has a status: available, reserved, sold. The workbook keeps cumulative revenue and compares it with planned revenue. At any time you can see whether the plots sold went above or below the floor, and what the remaining stock is worth.
10. What you receive, and what the grid does not do
- The plot-by-plot price grid, as a workbook: characteristics, reasoned coefficients, list price, floor, plot status.
- The plan coloured by price level, which shows at a glance where the expensive plots and the entry-level plots are.
- The method note: base prices, origin of each coefficient, negotiation margin, revision rule, assumptions of the residual check.
The limits need to be stated just as clearly. A grid distributes an average price that the market has to accept; it does not create demand. If the base price is too high, no set of coefficients will sell the subdivision. Coefficients remain judgements calibrated on data that is often scarce: the market for plots is thin, and comparable sales of a corner plot facing a garden do not come by the dozen. That is why the grid is designed to be revised as soon as the first sales bring information the study did not have.
The assignment is quoted on request, according to scope: number of plots, number of families, and the extent of the market study to be carried out beforehand.
The price grid rests on base prices drawn from the market study: the overall approach is presented on the market study and pricing for property development in Morocco page.
FAQ
Why not sell every plot at the same price per square metre?
Because buyers see the difference between plots. At a uniform price, the best locations go first, below their value, and the weakest plots stay in stock. A plot-by-plot grid charges for strengths and makes difficult plots saleable.
Where do the coefficients in the grid come from?
They are calibrated on the project's market: spreads observed in local sales and offers, a survey of competing subdivisions, then a reasoned judgement where data is missing. They are not constants valid everywhere, and each one is justified in the workbook.
What is the difference between the list price and the floor?
The floor is the expected market value of the plot, the one that comes out of the grid. The list price is the sales presentation price, set at the top of the justifiable range. The gap between the two is the negotiation margin, decided before launch.
How do you price a plot intended for an apartment building?
It is calculated with the grid, then checked with a residual calculation: revenue of the building allowed by the specifications, less costs and the buyer's margin. If the grid price exceeds what that appraisal can pay, it is corrected.
When should prices be revised during the sale?
When the observed pace departs from the expected pace, under a rule written before launch. A family of plots selling faster than planned justifies raising the remaining plots; a family that slows down calls for a diagnosis before any reduction.
How much does pricing a subdivision cost?
The assignment is quoted on request, according to scope: number of plots, number of families, and whether a market study has to be carried out or already exists. The quote lists the deliverables: workbook grid, coloured plan, method note.
Related reading
- Market study for a property development: the method, source by source
- Pricing plots and units for a property development
- Law 34-21 on subdivisions in Morocco: what changes
- How much is my land worth to a developer?
👉 Our service : market study and pricing for property development.
📚 All our articles : real estate insights blog.
A price grid for your subdivision
Base prices drawn from the market, reasoned coefficients plot by plot, list price and floor. Quoted on request, according to scope.
Describe my subdivision →